
The Best Pubs Around Badminton
Six gorgeous locations for your next visit to Badminton Horse Trials!

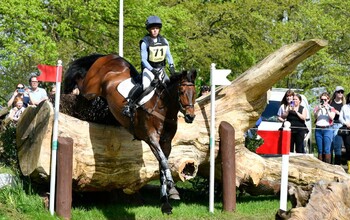
Riding with accuracy is important in every phase of eventing. From improving your centre lines and transitions in dressage to confidently tackling narrow fences and tricky lines on the cross country course. BE Master Coach, Caroline Moore, reveals a few of her favourite exercises to help your accuracy in all phases.
Six gorgeous locations for your next visit to Badminton Horse Trials!
8 days ago
Read More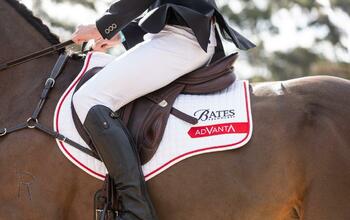
Ensure you are ready for the season by following this saddle safety checklist from Bates Saddles.
17 days ago
Read More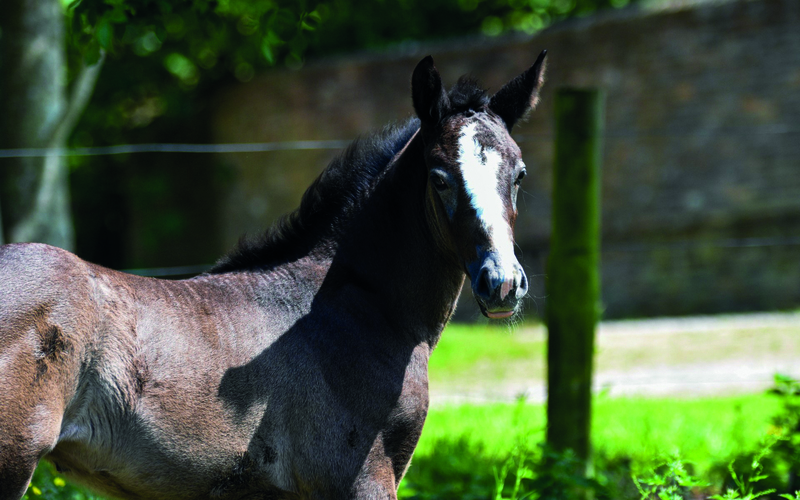
Alison Coleman explores how the modern assisted reproductive technologies can help with breeding from the competition mare.
17 days ago
Read MoreStuart Buntine, Director at BEDE Events, tells us what he loves about the sport
17 days ago
Read More-opt.jpg)
Ensuring your horse's joints remain in top-notch condition is not just about their overall well-being; it's the key to unlocking their peak performance potential.
about 2 months ago
Read More
January 17 is also known as 'Ditch New Year's Resolution Day', if your resolutions are based on your eventing aims and ambitions this season we have a few tips on how you can avoid celebrating this holiday and stay on track to achieve your 2024 goals.
5 months ago
Read More